Why spreadsheets fail covered call investors
For years, the spreadsheet was the default tool for tracking covered calls. But as trading frequency has increased and portfolios have spread across multiple brokers, the limitations of Excel and Google Sheets have become impossible to ignore.
The fragility of manual formulas
The average covered call strategy involves more variables than most investors realise: stock buy price, premium collected, strike price, expiration date, contract size, and dividends. If you roll a trade, you add adjusted cost bases and cumulative premiums. One misplaced decimal point or a broken cell reference can lead to catastrophic reporting errors. You might think you are yielding 4% monthly when your actual return is closer to 1.5%.
A dedicated covered call tracker removes the formula risk. Every premium, buyback and roll is stored against the same holding, so the adjusted breakeven and return figures are always derived from the same source of truth.
Multi-broker fragmentation
Modern investors rarely stick to one platform. Long-term holds might sit in one account while active trading happens in another. Consolidating this data manually in a spreadsheet is a logistical nightmare: different fee structures, export formats, and currency conventions all fight against one another.
A purpose-built tracker acts as a single source of truth. You get a unified view of your options income regardless of where the shares are held, with one portfolio total and one closed-trade history.
The lack of real-time visualisation
Spreadsheets are static. They tell you where you were yesterday, not where you are right now. In income investing, timing matters. Watching a static row of numbers does not give you the same intuitive feel for your portfolio as a dynamic yield curve, a status pie chart or an automated days-to-expiry countdown.
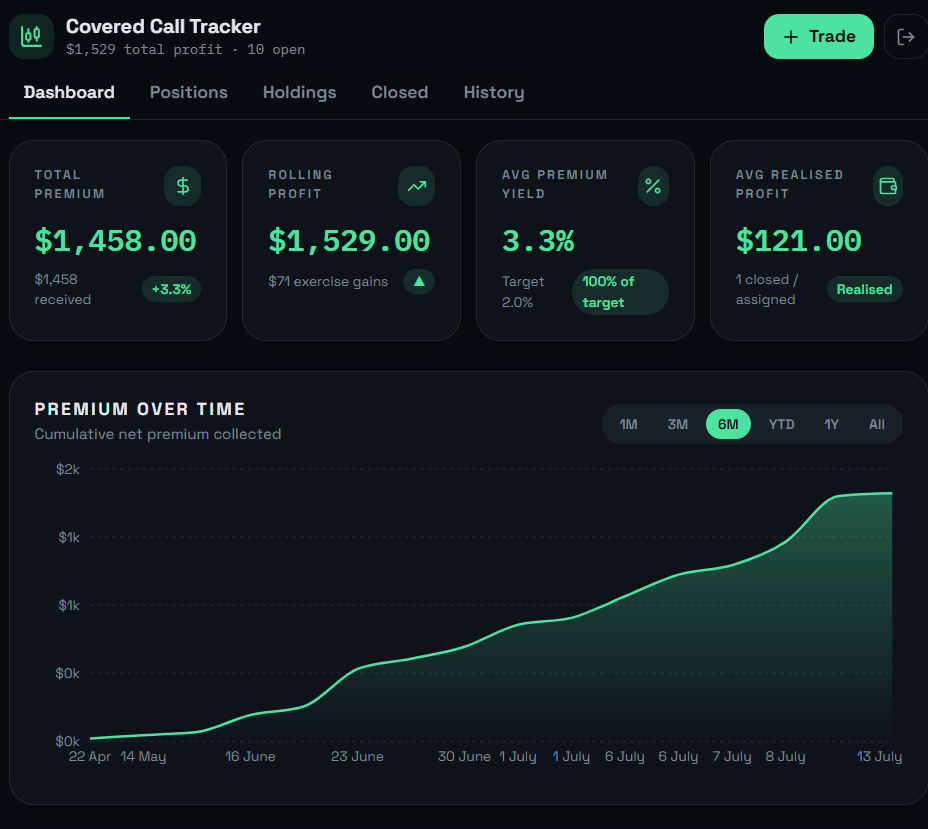
The OptionHarvest dashboard turns live price data, assignment status and premium history into a single, high-contrast view that updates without you touching a single formula.
Critical metrics a spreadsheet won't tell you
Most investors focus on the raw "Total Premium Received." While that is an important number, it does not tell the whole story. To truly master the covered call strategy, you need deeper insights that a standard spreadsheet simply is not designed to provide.
Annualised yield vs. raw premium
Smart investors focus on annualised return. Collecting $1.50 in premium might look great, but if it took 60 days to earn that on a $200 stock, your capital is underperforming compared to a 14-day trade with a $0.80 premium. Manually calculating annualised yield for every trade in a spreadsheet is exhausting; OptionHarvest does this automatically for every position.
Try the covered call yield calculator to see how yield changes with expiry length.
The true break-even point
Tracking your break-even is the key to risk management. Every time you sell a call, your cost basis drops. If you roll that call for a credit, it drops again. Knowing your exact break-even at any moment allows you to make informed decisions about when to close a trade or take an assignment.
OptionHarvest: the ultimate covered call tracker
We built OptionHarvest because we were tired of the manual headache. We wanted a tool designed specifically for the unique needs of covered call investors. Here is how the platform eliminates the spreadsheet struggle.
The real-time dashboard
The dashboard provides an instant snapshot of your entire portfolio's performance. You can see total premium received, rolling profit, and average realised profit in one clean interface. No more hunting for "that one tab" in your Excel file.
Detailed position management
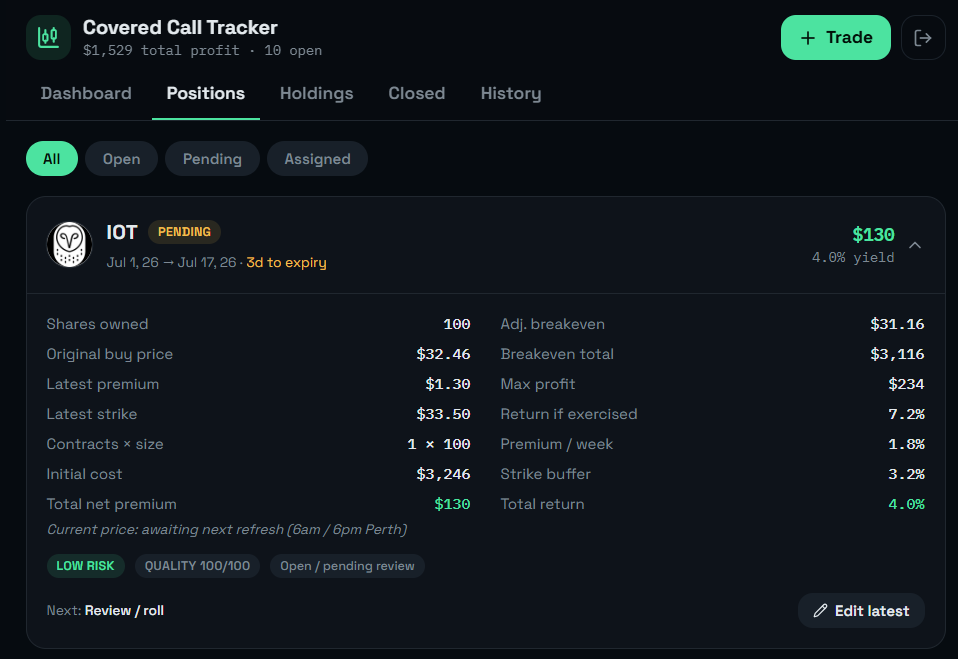
The Positions view is the heart of the app. It tracks every active trade, showing exactly how many days are left until expiry and what your current yield looks like. You can drill down into specific tickers like Microsoft or Nvidia to see the granular data that drives your income.
Automated rolling history
One of the hardest things to track in a spreadsheet is a rolled trade. OptionHarvest handles the rolling history for you, maintaining the lifecycle of each position so you can see the cumulative impact of your strategy over time.
Learn more about rolling correctly in our guide to covered call assignment risk.
Practical examples and real-world applications
Let's look at two investors: "Spreadsheet Sam" and "OptionHarvest Oliver."
Sam sells covered calls on five different stocks. He spends Sunday nights manually updating strike prices and expiries. When a stock rallies and he gets assigned, he spends an hour trying to figure out if he actually made money after accounting for dividends and premiums collected over the last three months. Because he is busy with data entry, he misses a chance to roll a trade for a higher credit.
Oliver uses OptionHarvest. He logs in for 30 seconds a day. He gets an automated alert that a position is five days from expiry and his annualised yield has hit his target. He sees his true break-even is well below the current market price, giving him confidence to hold through a minor dip. Oliver spends his time researching new income opportunities, not managing rows and columns.
Key takeaways
- Ditch the manual headache: spreadsheets are prone to errors and consume time that should be spent on strategy.
- Focus on yield: annualised return is better than raw premium for comparing trade performance.
- Track your break-even: knowing your total cost basis reduction is critical for risk management.
- Unified view: use a specialised tracker to consolidate data from multiple brokers.
- Measure to improve: automated visualisation reveals patterns that manual entry misses.
Conclusion: level up your income strategy
If you are serious about income investing, it is time to treat your portfolio with the professional tools it deserves. Stop fighting with clunky spreadsheets and start harvesting more income with the clarity of automated tracking.
OptionHarvest was built by investors, for investors. Whether you are just starting with your first 100 shares or you are managing a multi-broker portfolio, the platform gives you the insights you need to grow your wealth with confidence.
Frequently asked questions
- Can't I just use a template for Google Sheets?
- You can, but templates still require manual data entry and are easily broken by changes in broker exports or rolling trades. They lack the automated visualisation, real-time alerts and currency-aware totals of a dedicated platform.
- How does OptionHarvest help with tax reporting?
- By tracking every premium payment and realised profit in a clean History section, you have an organised record of all your income-generating activities, making year-end reporting significantly easier.
- Is OptionHarvest suitable for beginners?
- Absolutely. We simplify the complex jargon into clear steps: own shares, sell a call, collect premium. Our visual dashboard and free demo help you learn as you earn.
- What metrics are most important for income investors?
- While everyone likes Total Premium, we recommend focusing on Annualised Yield and Break-even Total to ensure you are maximising return while managing the risk of assignment.
- Does OptionHarvest support Australian stocks?
- Yes. As OptionHarvest.com.au suggests, we are built for investors globally, including those trading both US and Australian markets, with native currency handling and ASX price updates.