Covered call tracker vs spreadsheet: what breaks, and when
Every covered call investor starts in a spreadsheet. This guide walks through exactly where that spreadsheet fails, what a dedicated covered call tracker does instead, and how to keep your premium, breakeven and assignment risk honest as your options income portfolio grows.
Why covered call investing looks simple and gets messy
Covered call investing is one of the most approachable options strategies there is. You own at least 100 shares, you sell a call above the current price, and you keep the premium. If the stock finishes below the strike the call expires worthless and you write another one. If it finishes above, your shares are called away at the strike and you keep every cent of premium collected along the way.
The strategy is simple. The record keeping is not. One position, held for a year, might involve twelve calls written, four rolls, two buybacks, a dividend and finally an assignment. Your actual profit depends on every one of those events being counted correctly, in the right order, against the right holding.
The covered call spreadsheet problem
A covered call spreadsheet works beautifully for about ten trades. Then reality shows up.
Rolling quietly corrupts your numbers
This is the big one. Say you own 100 shares of Coca-Cola (KO) at $60.00 and sell a $65 call for $1.20. Two weeks later KO runs to $64 and you roll: you buy the call back for $2.10 and sell a later $67.50 call for $2.80.
Your net premium is $1.20 − $2.10 + $2.80 = $1.90 per share, so your adjusted breakeven is $58.10, and if you are assigned at $67.50 your total return includes that $1.90 as well as the $7.50 of share appreciation. In a spreadsheet, most people log the roll as a brand new row with a $2.80 premium and a $65 strike from the old row still sitting above it. Breakeven is now wrong, the return figures downstream of it are wrong, and nothing warns you.
Prices go stale immediately
Distance to strike is only useful if the price is current. A sheet with prices you pasted in last Thursday cannot tell you that Tesla (TSLA) has pushed through your strike and assignment is now likely.
Multiple brokers, multiple tabs
Shares at one broker, an old holding at another, an ASX parcel somewhere else. Each becomes its own tab with its own conventions, and there is no single number for how much capital you actually have at work or how much premium the whole book has produced.
Currency turns totals into fiction
Mixing an AUD holding like Guzman y Gomez (GYG) into a USD sheet with a hard-coded FX rate makes every portfolio-level figure approximate at best.
Closed trades disappear
The most valuable data in covered call portfolio management is your own history: which tickers have genuinely paid you, which ones you keep writing against at a loss, whether premium income actually beat just holding the shares. Spreadsheets bury that under rows nobody revisits.
What covered call software does instead
OptionHarvest was built by an investor who hit every one of those walls. It tracks covered calls and nothing else, which is precisely why the numbers stay right.
The metrics an options income tracker should give you
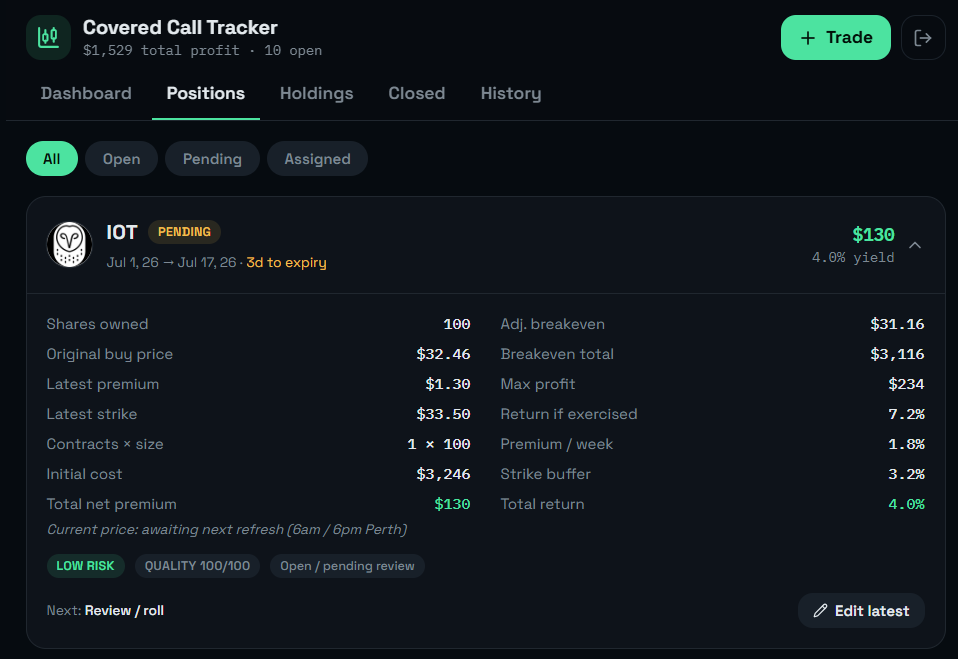
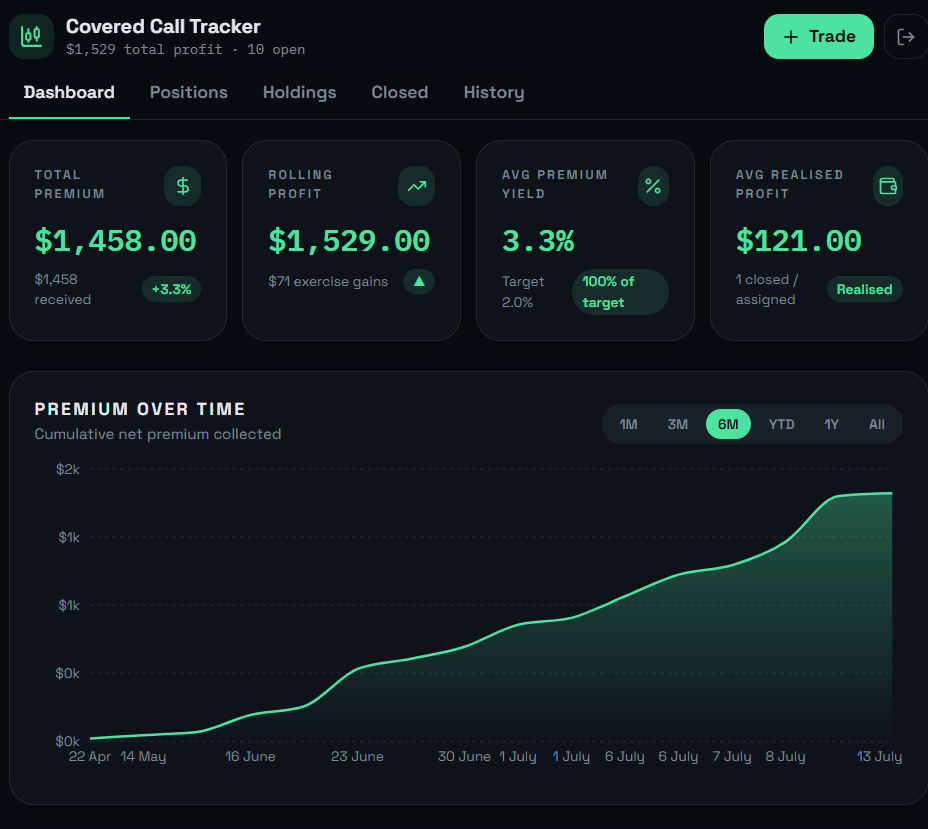
- Net premium collected per holding and lifetime
- Adjusted breakeven after every roll and buyback
- Premium yield per week, so weekly and monthly writes compare fairly
- Total return if exercised, including all previous premium
- Days to expiry and distance to strike
- Capital at work, capped at strike for committed shares
Side by side: spreadsheet vs covered call tracker
| The job | Covered call spreadsheet | OptionHarvest |
|---|---|---|
| Current share price | Pasted in by hand, stale within a day | Refreshed daily, US and ASX |
| Rolling a call | A new row that breaks breakeven | One event against the same holding |
| Adjusted breakeven | A formula you hope still points at the right cells | Recalculated on every premium and buyback |
| Assignment status | You remember to check, or you do not | Marked automatically when the close is above the strike |
| Multiple brokers | One tab each, no combined view | One portfolio, whatever the broker |
| Two currencies | Manual FX, silently wrong totals | Native currency plus a currency switcher |
| Which calls expire this week | Sort, filter, squint | Days to expiry on every open position |
| Was that trade actually profitable? | Rebuild the history from memory | Closed log with realised profit and outcome |
A worked example: one year on Apple
Suppose you own 100 shares of Apple (AAPL) with a cost basis of $180.00. Over a year you write monthly calls and collect $2.00, $1.60, $2.40, $1.10 and so on. Two of those months you roll rather than let the call go in the money, paying $3.20 and $2.60 to buy back. By month twelve you have collected $19.40 in gross premium and paid $5.80 in buybacks.
Net premium is $13.60 per share. Adjusted breakeven is $180.00 − $13.60 = $166.40. If a $195 call is finally assigned, your realised return is $15.00 of share gain plus $13.60 of premium on $180.00 of capital — about 15.9%, not the 8.3% the assignment alone suggests.
That is the number a spreadsheet almost always gets wrong, and it is the number that tells you whether covered call income is worth the upside you gave away. Run your own scenarios with the free covered call calculator or the yield calculator.
Covered call management, end to end
Good covered call management is not just logging the sale. It is handling every way a position can end: expiring worthless, being rolled, being assigned, or being closed early by buying the call back and selling the shares when a trade turns against you. OptionHarvest records all four, so your closed-trade history shows the real outcome instead of a phantom assignment.
Pro accounts also get daily price updates across US and ASX tickers, dividend tracking, trade history exports, live chart links and an automated monthly summary report by email.
When you should still use a spreadsheet
Honestly: if you hold one stock, write one call a quarter and never roll, a spreadsheet is fine. The moment you have three or more holdings, roll positions regularly, or cannot answer "what is my breakeven on this ticker right now?" in under ten seconds, you have outgrown it.
Keep reading
Frequently asked questions
- Is a covered call spreadsheet good enough?
- For your first handful of trades, yes. A spreadsheet stops working once you roll positions, hold shares at more than one broker, trade a second currency, or need to know at a glance which calls expire this week. At that point the maintenance cost is higher than the insight.
- What does covered call software do that a broker platform does not?
- Brokers show fills and positions, not strategy. They rarely roll premium into your adjusted cost basis, they do not report lifetime premium per holding, and closed trades vanish into a transaction list rather than a strategy-level record you can review.
- How do I track a rolled covered call correctly?
- A roll is one event against one holding, not two separate trades. The buyback debit and the new credit both belong in the same running net premium so your breakeven — and every return figure derived from it — stays correct.
- Can an options income tracker handle ASX and US stocks together?
- OptionHarvest tracks US and ASX holdings in their native currency and lets you view portfolio totals in whichever currency you prefer, so an AUD holding does not distort your USD numbers.
- How much does OptionHarvest cost?
- There is a free demo with up to 2 trades. Pro is $5 USD per month with a 7-day free trial, cancel any time. Taxes may apply and are calculated at checkout.
Conclusion: stop maintaining the spreadsheet
A covered call spreadsheet does not fail loudly. It fails quietly, one wrong breakeven at a time, until you no longer trust your own numbers. A purpose-built covered call tracker keeps the ledger for you: premium accumulates, breakeven adjusts, prices refresh, assignment is detected, and closed trades tell you the truth about your covered call strategy.